Social Construction of Drug Problems
Part 3. Media Constructions of Drug Epidemics
Media Definitions
of Deviance: The "Coke Plague"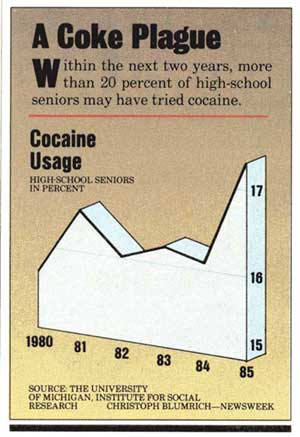
A more recent and sophisticated example of media construction of a drug problem--the "Coke Plague"--is shown here. This visual image was constructed by a graphic artist, Christoph Blumrich, for an article featured on the cover of the March 17, 1986 issue of Newsweek, "Kids and Cocaine: An Epidemic Strikes Middle America." The text that appeared next to this graph made the following claim:
There is simply no question that cocaine in all its forms is seeping into the nation's schools. An annual survey conducted by the Institute of Social Research at the University of Michigan shows the percentage of high-school seniors who have ever tried cocaine has nearly doubled in the past 10 years, from 9 percent to 17.3 percent (p. 63).
However, on close inspection, you might notice a few peculiar features of this dramatic graphic image, which is based on the Monitoring the Future survey of high-school seniors. First, whereas the text of the article refers to a 10 year period in which cocaine use "nearly doubled," the graphic only shows six years of data, 1980 to 1985. Why would the graphic artist exclude the earlier data for 1975 to 1979? Second, although it is not clearly indicated, the percentages in this graphic refer to lifetime prevalence, rather than the more contemporaneous measures of annual or thirty-day prevalence. Why include every student who "ever tried cocaine" in this image of "cocaine usage"? Third, you might notice that the percentages on the edge of the graph—the "y-axis"—begin at 15 percent instead of zero. What happened to the bottom 15 percent of these data? Fourth, note that the subheading for the graph suggests that "[w]ithin the next two years, more than 20 percent of high-school seniors" may try the drug. How can this graphic artist see two years into the future? Finally, although it is not mentioned in the text of the Newsweek article nor in the graph, none of the year-to-year changes in lifetime prevalence from 1980 to 1985 were statistically significant—that is, these yearly changes probably reflect random sampling fluctuations. Or, to put it another way, the dramatic "Coke Plague" shown in this graph was actually constructed from a flat line by the graphic artist.
In one of the readings for this section, "Shocking Numbers and Graphic Accounts," Orcutt and Turner examine the Newsweek "Coke Plague" and other statistical claims about cocaine use that appeared in the print media starting in 1986. Although many of the examples they analyze are subtle and far less dramatic than was anti-marijuana propaganda in the 1930s, these carefully crafted definitions of drug-related deviance may be all the more influential as a result.
Online reading: James D. Orcutt and J. Blake Turner, "Shocking Numbers and Graphic Accounts: Quantified Images of Drug Problems in the Print Media," Social Problems 40 (May 1993). (Click here)